Today is the anniversary of the First Fleet’s arrival in Sydney Cove, only 228 years ago. A defining moment, certainly, although more and more people agree that the 26th of January is not the right day to honour all things Australian.
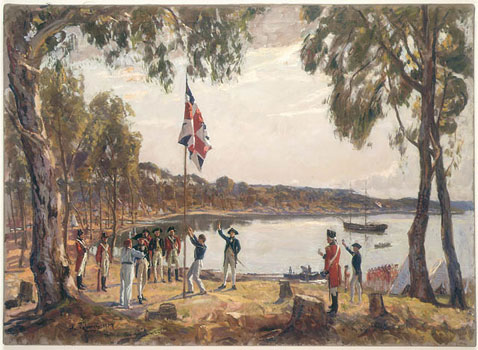
To commemorate the date, let’s have a look at Australia’s earliest weather observations. Their history, funnily enough, began at exactly the same time…
Australia’s first weather observations
It is important to acknowledge first that while the earliest written records of Australia’s weather come from English settlers, Aboriginal culture is inseparable from the local environment, climate and seasonal cycles. In that way, indigenous knowledge is important for understanding future climate change impacts.
However, it’s only recently that Aboriginal oral histories have started to be combined with scientific methods. For now, our written record of climate variability is limited to when the English lobbed up, in 1788.
The earliest meteorological observations from the British colony that would become known as Australia were not actually taken on land, but at sea. William Bradley, a Lieutenant with the First Fleet, diligently recorded temperature and atmospheric pressure at noon each day onboard the HMS Sirius during its voyage from Portsmouth, England in May 1787 to Australia in January 1788.
Bradley continued to take atmospheric pressure observations at Sydney Cove until February 1788, and temperature until the start of October 1788. Additional pressure and temperature observations were also recorded by fellow sailor John White from 20–25 January until his instruments broke, including the last of his six thermometers.
The first land-based weather observations for Australia then commenced on 14 September 1788, recorded by Lieutenant William Dawes. Dawes was a young astronomer trained at the Greenwich Observatory in England. He was sent to Australia by the Board of Longitude to observe Halley’s comet which was expected to appear in the southern skies in 1788.
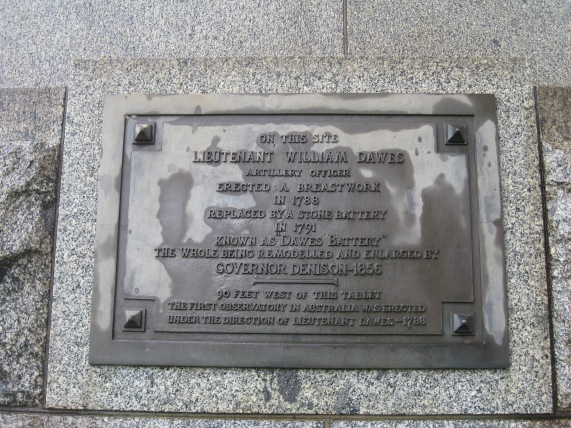
A modest wooden astronomical observatory was built for Dawes on a small headland in Sydney Cove, now known as Dawes Point, near where the southern pylon of the Sydney Harbour Bridge currently stands. You can visit the spot today and see a plaque dedicated to this humble structure.
Although the comet never appeared, Dawes took detailed astronomical readings and recorded weather observations between three and eight times a day until December 1791.
Interestingly, Dawes only started recording rainfall in September 1791. He used a rain gauge constructed from a funnel and a ‘common quart bottle’, and measured the rainfall in number of ‘grains’ of weight.

Today, rainfall is Australia’s most commonly observed meteorological variable. But in 1788, it was not such a big deal. In fact, standard numerical rainfall observations did not really start in Australia until the early 1820s.
One explanation for this could be that the early settlers did not understand the highly variable nature of Australian rainfall compared to England’s more reliable rain, and so did not think to record it until water became scarce.
Another possibility is that Dawes, as a trained astronomer, was used to only taking observations for astronomical calculations. Similarly, he may have only been familiar with recording the weather aboard a ship, where rainfall is not important for navigation and is difficult to measure.
Regardless, Dawes left the colony shortly after his three years of observations, due to a dispute with the Governor over the treatment of the local Aboriginal people. His valuable meteorological journal remained lost to Australia until it was uncovered in the 1970s at the English Royal Society by a PhD student at Macquarie University.
The meteorological data from the journal were then analysed by Gergis et al. 2009, and later by my colleagues and I, over 200 years after they were taken.
So, what was the weather like back then?
Dawes’ and Bradley’s observations give us a chance to look at what the weather was like during the first three years of British settlement in Australia. Here is a graph of the monthly maximum temperature (Tmax), minimum temperature (Tmin), sea level pressure and rainday counts from Dawes and Bradley, relative to the 1910–1950 mean values in Sydney.
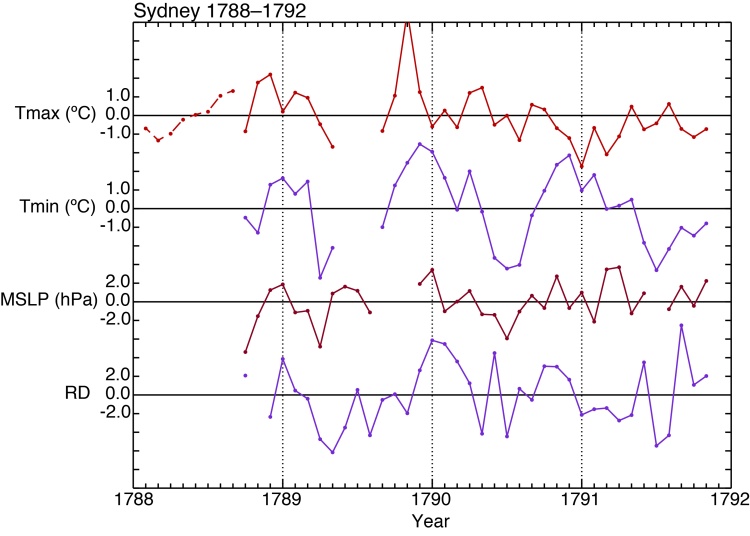
Bradley’s noon observations suggest that a cool summer (austral summer that is, December–February) and autumn (March–May) greeted the British settlers when they arrived in early 1788.
Documentary reports show that the first six months of settlement were also dominated by wet weather, including a number of violent storms that killed livestock and destroyed newly built buildings. The anomalies of Bradley’s temperature readings indicate that this was followed by a mild winter (June–August), but the absolute temperatures suggest cool conditions.
The following summer of 1788–1789 was warm according to Dawes’ temperature observations, with average to wet conditions. Dawes recorded a seasonal maximum of 12 raindays during January 1789, including four consecutive days of rain from 9–12 January.
Rainday counts recorded for autumn and winter of 1789 indicate that dry conditions prevailed during that year. Written records of the day also reported dry weather. The only exception is April 1789, when low pressure values were recorded, along with a marked drop in temperature.
The summer of 1789–1790 saw an end of the dry conditions, and a return to warm and wet weather. In particular, November 1789 was very warm, while Dawes’ rainday count was above the 1910–1950 Sydney average from December 1789 to April 1790. This is supported by evidence of flooding in Sydney during February 1790 and reports of rain during much of the first half of 1790.
1790: drought sets in
However, during the second half of 1790, both Dawes’ data and the documentary record point to a decrease in the amount of rainfall received in Sydney, taking the European settlers into their first prolonged Australian drought. Below-average rainday counts were recorded for most of 1791, and the impacts of the drought were reported by many of the early settlers.
The summer of 1790–1791 also included several days of extreme maximum temperatures, some of which were so hot that bats and birds were reported to have dropped dead from the sky. According to settler Watkins Tench:
An immense flight of bats driven before the wind, covered all the trees around the settlement, whence they every moment dropped dead or in a dying state, unable longer to endure the burning state of the atmosphere.
This phenomenon, which is sadly becoming more common in recent years across Australia’s north, has been studied by ecologists. They found that bats die from heat stress at temperatures around 42ºC.
The maximum temperature recorded by Dawes’ during that season was 103.5ºF (39.7ºC) at noon on 27 December 1790. The highest estimated Tmax value for summer 1790–1791 that I calculated using Dawes’ observations was 43.1ºC, also on 27 December 1790, in pretty good agreement with those poor bats.
Although the settlers sweltered through some extreme temperatures in summer 1790–1791, the monthly averages you can see in the graph indicate that cooler than normal maximum temperature conditions were experienced overall, although the mean Tmin values were very warm.
This difference between daily extreme temperature values and monthly means is similar to that observed in January 1939, where a record high temperature of 45.3ºC was recorded on 14 January in Sydney, but the monthly mean Tmax was near normal (26.1ºC).
According to documentary records the drought continued until 1792, when wet conditions set in and continued until about 1797.
But what does that mean for climate change?
One feature you might notice in Dawes’ temperature observations is that a seasonal cycle is still apparent. Positive temperature anomalies are present during summer and negative anomalies during winter, particularly for minimum temperatures.
This could suggest that the austral summers of 1788–1791 were indeed warmer than the 1910–1950 average, while the austral winters were cooler, due to rainfall variability or the influence of the El Niño–Southern Oscillation (ENSO) on eastern Australia’s temperature.
But it is much more likely that this residual seasonal cycle reflects sub-standard instrument exposure. In other words, the thermometer was recording more than just the ambient air. This shortcoming means that Dawes’ weather observations are not reliable enough to compare directly with temperatures recorded today.
The quality of observations for monitoring long-term climate change must be very high, with standard observation techniques. This is one of the reasons why the high-quality temperature dataset from Bureau of Meteorology only begins in 1910.
What historical observations like Dawes’ are useful for is understanding past climate variability, and the impact of things like ENSO on our year-to-year climate. The fact that Dawes recorded the air pressure up to eight times a day is also great for reanalysis projects like the 20th Century Reanalysis, which uses air pressure to reconstruction how the atmosphere was behaving more than 100 years ago.
His meteorological dedication, and that of other English settlers, show us that the floods in 1789 and the drought of 1790–1791 had a big impact on the expansion of Australia’s early settlement.
The work of Australia’s first meteorologist also helps us continue to understand how the the daily weather affected Australia’s early settlement, just as it affects our barbecues and reconciliation rallies today.

Great post, Linden! I’ll definitely make a point of sharing it via AMOS social media channels. On the topic of the history of meteorology, have you read The Weather Experiment by Peter Moore? It came out last year and I’m about half way through reading it at the moment. So far it’s a fascinating and very well written (i.e. not a dry textbook!) account of the history of meteorology. I’ve been looking for an equivalent history of oceanography (partly because I’m starting an oceanography postdoc at CSIRO next month!) and so far Mapping the Deep by Robert Kunzig looks promising, although it is 16 years old.
LikeLiked by 1 person
Hi Damien, thanks and congratulations! I haven’t read The Weather Experiment yet, but it is definitely on the list now. Mapping the Deep looks awesome! I just finished Defining the Wind by Scott Huler, which is all about the Beaufort Scale. It includes a lot of maritime history, but not too much about the murky depths…
LikeLike
Hello Linden — thought you might like this extract from an early poem about a day very close to Australia Day date:
A hot day in Sydney
27th January 1829 — Anonymous
0 this weather! this weather!
It’s more than a mortal can bear;
I feel we shall all melt together,
So dreadfully hot is the air. …….
And there you be tossing and tumbling,
So beated, and bitten, and stung,
So weary of puffing and grumbling, —
You are ready to wish yourself hung. ……..
And such are the pleasures of summer
In this Australasian land –
How charming to every newcomer,
If thus they can charm an old hand!
Mary
LikeLiked by 1 person
Thanks so much for sharing Mary, that poem is just wonderful!!
LikeLike