This post contains a lot of links to scientific articles that may be paywalled, or just as bad, really technical. Just let me know if you need a copy of any of them, or if they don’t make sense.
Ah, teleconnection. What a word. Much like ‘madrugada‘ does not have a translation into English, or ’serendipity‘ does not have a Spanish equivalent, teleconnection is a term that is hard to translate into normal words without it losing some of its beauty.
But let me have a try. Essentially, teleconnections are the connections between weather and climate in one place, and weather and climate in another. No, that’s not it. A teleconnection is the remote influence of large-scale atmospheric circulation patterns. No that’s worse. It’s the effect that the climate in one place can have somewhere else. It’s teleconnection.
Think of it kind of like a huge trampoline. If you are in the right spot, and at the right time in your bounce, when someone else bounces it will affect your bounce, either by flinging you off into the fence, or ruining your bounce completely. Now replace the word bounce with the word weather (and forget the bit about the fence). Yes, that’s teleconnection.

ENSO, the most famous of them all
The most famous teleconnection pattern is the one associated with El Niño–Southern Oscillation (ENSO), that lovely see-saw pattern of sea surface temperatures and atmospheric pressure that occurs around the tropical Pacific and Indian Oceans. ENSO is the dominant driver of year-to-year climate variability across the world. When the trade winds weaken, warm water that is normally blown from east to west towards Indonesia sloshes back towards South America, making Australia’s tropical seas a bit cooler. This is also associated with an increase in pressure, leading to drier and warmer conditions over tropical Australia (the topic of which comes first, the pressure anomaly or the sea surface temperature anomaly, is a bit of a chicken and egg situation).
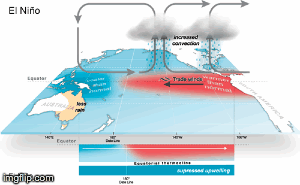
This pattern of cooler ocean temperatures near Australia is an El Niño event. The opposite occurs during a La Niña event, when lower pressure, warmer water in the western Pacific and stronger trade winds dominate. These patterns have a direct impact in the tropics, with El Niño events for example associated with floods in Peru and surrounding countries, and dry conditions over Queensland and Indonesia. But there is also an indirect impact, or TELECONNECTION, that can be felt all over the world.
ENSO effects have been found in the US, Europe, China, Antarctica and of course Australia. The atmospheric and oceanic patterns cause what are essentially atmospheric ripples, or wave trains if you want to be technical about it, suppressing or enhancing particular climate conditions. El Niño events are monitored very closely in Australia because they are closely linked to hot and dry weather in the southern part of the country, even though this area is 2,000 km away.

Consistent inconsistencies
Now, these teleconnections don’t always behave the same. The strength of La Niña events are more linearly related to wet conditions than the strength of El Niño events are related to drought, for example. Different flavours of ENSO leave different fingerprints across Australia and the globe. Other climate features, like what is happening around the Southern Ocean, or the Indian Ocean, can also affect how ENSO teleconnections are delivered (although there is much debate about whether these other features are really independent of ENSO at all).
And sometimes, these patterns seem to just break down completely for a few years or decades. These times of weakened teleconnections are fascinating, and yet no-one is really sure why they happen. Some people think that they are due to another, slower, pattern in the Pacific Ocean called the Interdecadal Pacific Oscillation, which messes with the ENSO signal. Others find that the behaviour of ENSO itself changes they way that its remote influence is felt.
Different researchers have suggested that changes in the global climate can change teleconnection patterns, for example global cooling due to volcanic eruptions. This theory has interesting implications for climate change, as the behaviour of ENSO in a warmer world is a big unknown. And there are some who argue that these changes are just random, noisy patterns of the natural world.
One period of low teleconnection strength, when ENSO’s remote ripple just did not get through to Australia was the 1920s to 1950s. During this time, ENSO events just did not pack the same punch as they normally do. But this is the only real time of weak ENSO teleconnections in the 20th century, in the modern instrumental record. To look at other instances, we need to go further back in time, which of course, makes everything a little murkier.
Palaeoclimate data from the US and the Australian region suggest that the early part of the 1800s was also a time when ENSO events did not register as much in regions away from the centre of action. El Niño and La Niña patterns are recorded in the corals across the Pacific Ocean, but there is not much of a corresponding temperature or rainfall pattern in the tree rings or ice cores of distant spots that are normally affected by ENSO. However, there are very few instrumental records that can look into this strange time with much detail. Until now.
What can old Australian rainfall tell us?
One part of my PhD work was looking at the relationship between ENSO and southeastern Australian rainfall in the 19th century, using some historical rainfall observations. My group and I recovered rainfall data and counts of the number of rain days from more than 20 sources in southeastern Australia. Some came from a farmer’s diary in New South Wales, others were from a doctor in northwestern Tasmania. Rain day records were published in local Sydney newspapers from the 1820s, while from 1841 the Government set up official observatories in Melbourne, Sydney and Port Macquarie where numerical rainfall observations were taken.
I put all of this rainfall information together, and compared it against other related data (like air pressure and temperature) as well as written records of the time, to check that it was relatively reliable. It was. Next I combined the historical data with modern rainfall observations to create a record that went from 1788 to 2012 (there are some gaps before about 1832).
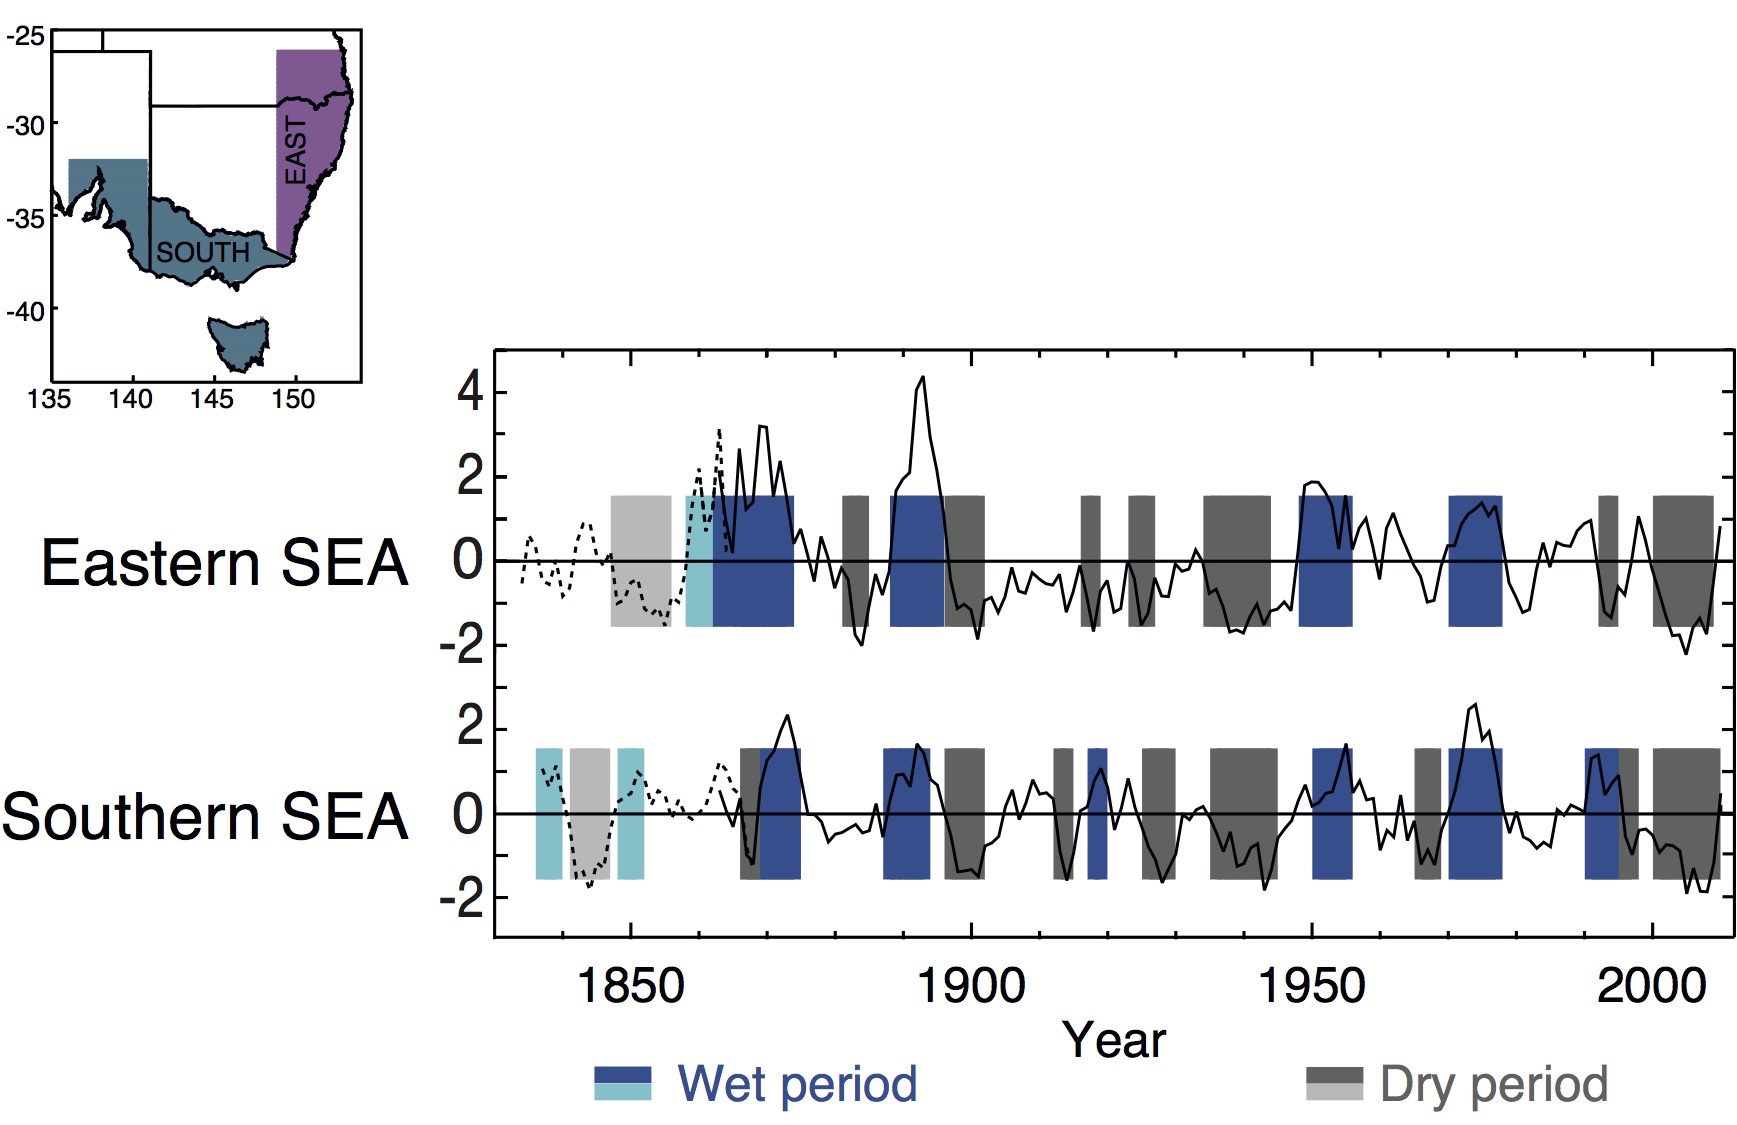
From here I compared the rainfall data to a range of different databases (or reconstructions) of ENSO behaviour. One ENSO chronology gave a category for each year (weak, strong, extreme etc), based on palaeoclimatic and documentary records of the past. Two others used information from trees and coral to determine a numerical value of El Niño or La Niña strength, meaning that I could calculate correlations and other fancy graphs. Comparing these three ENSO records to my rainfall data, I found some evidence that the ENSO signal was absent during the first part of the 1800s, about 1835–1850, especially in the data from Tasmania and Victoria. Or rather, I did not find strong evidence that it was around.
As a (attempting to be) good scientist, my next question was, why? What is going on in this early period? I looked at several different options, including:
- Unreliable old data giving me strange results
- ENSO was behaving weirdly during the first part of the 1800s due to the Interdecadal Pacific Oscillation, with few extreme El Niño events, causing strange results
- The Indian Ocean was behaving weirdly, messing up the ENSO teleconnection over southeastern Australia, causing strange results
- The westerly winds over southern Australia (which are often represented by the Southern Annular Mode) were behaving weirdly, messing up the ENSO teleconnections over southeastern Australia and, you know, causing strange results.
In the end, I found that all of these things could have influenced the results, with the possible exception of the Indian Ocean. The issue with looking further back in time, particularly in the Southern Hemisphere is that there are not so many reliable sources of temperature and rainfall information. The two reconstructions of the Southern Annular Mode that I looked at, for example, did not agree over the early part of the 1800s.
Overall, the old rainfall data seem to agree with the natural, palaeoclimate indicators of ENSO behaviour that suggest something strange was going on in the early to mid 1800s, although the results are not quite significant enough to be sure. While these findings are not going to make the front page, they do provide us with another piece of the puzzle about how our climate behaves, helping us prepare for what it might do in the future. Now, I’m off to find a trampoline…
More information:
Ashcroft, L., Gergis, J. and Karoly, D.J., 2015. Long-term stationarity of El Niño–Southern Oscillation teleconnections in southeastern Australia. Climate Dynamics, online view, DOI: 10.1007/s00382-015-2746-3 (paywalled but accepted manuscript available here).

One thought on “Teleco-what now?”